When you install the Manfiest version of our products, it may appear that FX Graph and FX Stat have "disappeared".
THEY HAVEN'T. We would just prefer that you do not use them. They are still available from your Start menu
Why Do We Hate FX Graph and FX Stat?
We don't hate them at all! What we want you to do is to use the function graphing and statistical graphing tools in FX Draw instead.
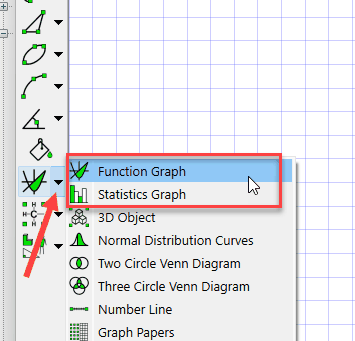
The function graphing and statistical graphing tools in FX Draw are exactly the same as FX Graph and FX Stat. They do exactly the same jobs. They do, however, offer two major advantages over the standalone products:
| • | They understand parameters (which allows you to do all of the fancy regeneratable question stuff). |
| • | Your graphs appear in a full drawing environment which makes it MUCH easier to add things to them. |
In summary, you will be much better served getting into the habit of using the FX Draw versions of these tools. FX Graph and FX Stat are really designed for use by students. The FX Draw versions provide you with vastly more flexibility to create the materials you need as a teacher.