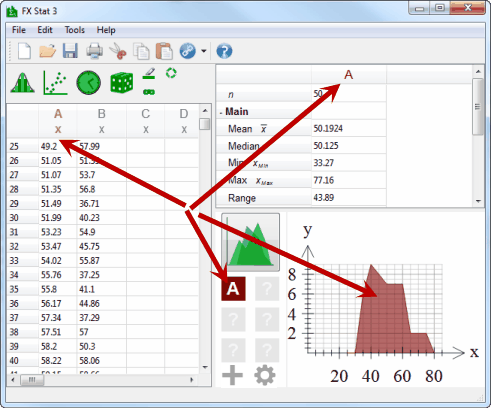
The statistics tool automatically generates summary statistics for any data column that you have graphed. If you are graphing a two variable graph type, the statistics tool will automatically generate two variable statistics. Colour coding is used to relate the three views together.
