
The Stem & Leaf plotting tool can graph up to two data boxes. There are some differences in the way the Stem & Leaf tool plots when compared to the other tools:
| 1. | The tool does NOT resize the plot to suit the display rectangle. All other tools automatically fit the graph into the rectangle. Because the Stem & Leaf plot’s size is determined by the font used, this is not possible. |
| 2. | The Stem & Leaf tool can only plot information whose range is less than (about) 300. This means that some data sets will not be plotted in any reasonable form. This is an inherent limitation of Stem & Leaf plots rather than our tool. |
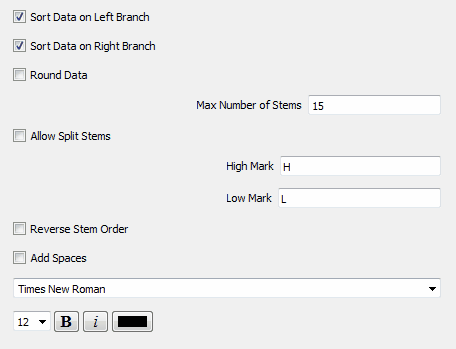
Sort Data on Branches
This option sorts the data on the branches in ascending order (lowest closest to stem). The left and right branches can be sorted independently.
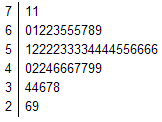
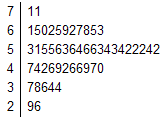
Sorted Data Unsorted Data
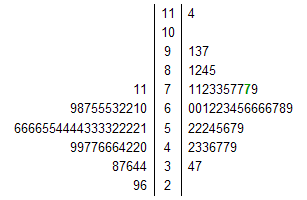
Sorting on double sided stem & leaf plots always places the lowest values closest to the stem.
Round Data
The stem & leaf plot tool automatically allocates continuous data to the correct branches. For example, 52.345 would have automatically be allocated as a 2 in the 5 branch in both of the stem and leaf plots below.
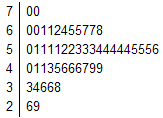

Data not Rounded Data Rounded
The round data option determines what the tool does with a data value like 70.68. If round data is turned off, this will be truncated to 70 and be entered as a 0 on the 7 branch. If round data is turned on, this is rounded to 71 and will be entered as a 1 on the 7 branch.
Max Number of Stems
This determines the maximum number of stems that the tool uses to create the stem & leaf plot. 15 is a good default.
Allow Split Stems
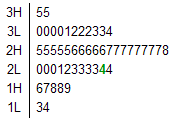
Graphing data with a small range on a stem & leaf plot can create a plot with a small number of long branches.

In these cases, it is often a good idea to split the stems into a high and low branches. This increases the number of stems and can give a better impression of the shape of the data.
Reverse Stem Order
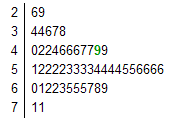
Simply reverses the order of the stems.

Add Spaces
Adds extra space to the leaves to spread out the data.