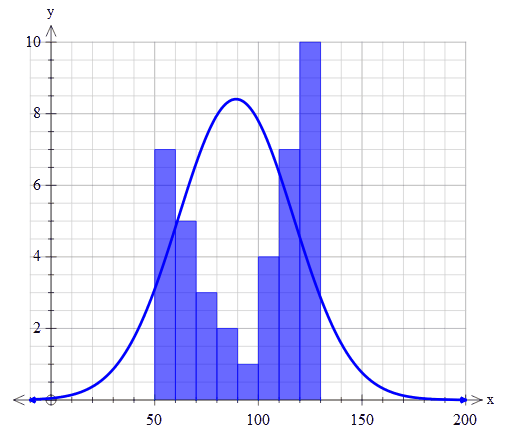
The normal distribution curve draws a standard normal distribution curve with the same mean and standard deviation as the selected dataset. The curve is based SOLELY on the mean and standard deviation so will not reflect any underlying skewness. The curve is useful for demonstrating difference between real data and normal distributions.

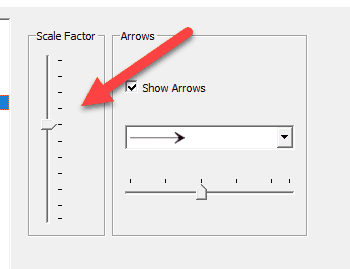
When editing a normal distribution curve, you will find a scale factor slider.

This is used to scale a normal distribution curve to match an existing histogram or other graph type. It is needed to produce visually appealing graphics.