Entering Inequations
Inequations are entered by replacing the = sign in your equation by either,
>, <, >= or <=
Inequations can be entered for all function types except parametric.
x + y <= 4
r > 2 sin th
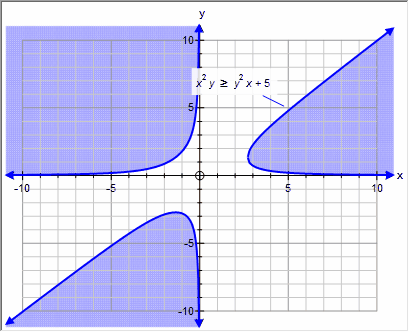
xy2 >= yx2 + 4
A
y >= 2x-7
A
x > 0
|z| <= 4
The graph tool will produce a shaded graph depending on your Feasible Region Options.
Inequation Shading Options
On many occasions, you will be entering a number of inequations and trying to identify the region that satisfies ALL the inequations - also known as the feasible region.
The graph tool can show the feasible region in a number of ways - depending on your needs. The feasible region options can be changed by opening the Quick Entry screen
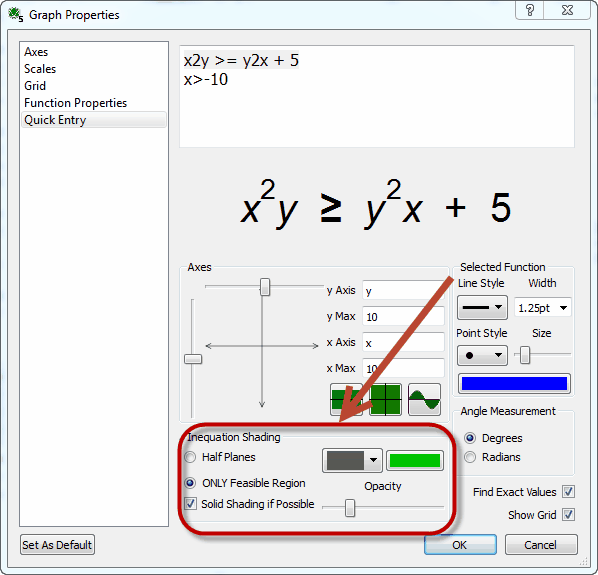
The Feasible Region options are described in the next sections.
Half Planes or Feasible Region
When graphing multiple inequations, the graph tool can graph each as a half plane, or combine the inequations and shade ONLY the feasible region.
For example, if we graph 2x + y <= 8 and x + 2y <= 10
Half Planes
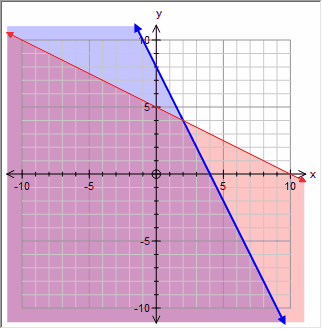
Shading half planes
When shading half planes, the graph tool shades the region which satisfies each equation INDIVIDUALLY. In the above example, the region which satisfies both inequations has been shaded twice. the graph tool uses each function's color for its shading.
But Wait! I Was Expecting The Graph Tool to Shade the Other Side!
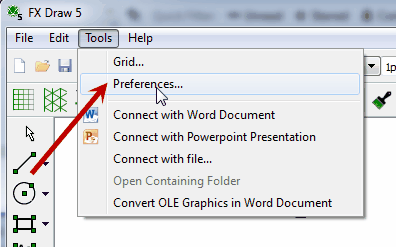
Unfortunately, which side of the inequation to shade depends on where you live. Some school systems want the side that satisfies the inequation shaded - some the side that does NOT satisfy the inequation. the graph tool can handle either. Choose Preferences from the Tools menu and then select Graph
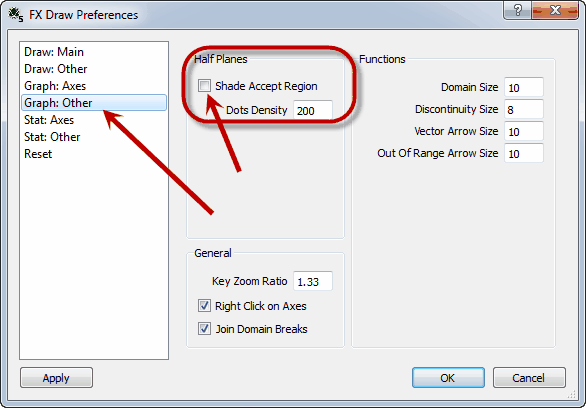
In the screen above, the graph tool is set to shade the region which satisfies the inequation. If I uncheck the box, the graph tool will shade the region which does not satisfy the inequation. This setting only affects Half Plane Shading.
Only Feasible Region
Alternatively you can tell the graph tool to shade ONLY the feasible region. This is often clearer.
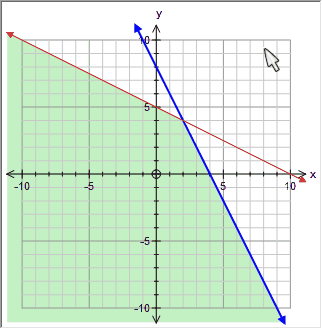
In this graph, the graph tool has calculated the region which satisfies BOTH inequations and has shaded just that region. The area is shaded using the color, style and opacity selected in the Quick Entry screen.
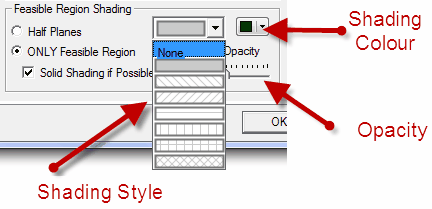
Shading for One Inequation
If you only enter one inequation, FX Draw will use Half Plane shading (honoring your setting for which side to shade) regardless of the Half Plane/Feasible Region setting.
Solid Shading

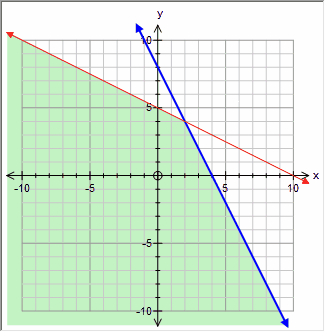
Solid Shading
Solid shading is one block of solid color. Solid shading has the advantage of being faster to calculate and displays better on some devices. The graph tool uses solid shading when you have allowed it to and when the system of inequations is not too complicated for its systems.
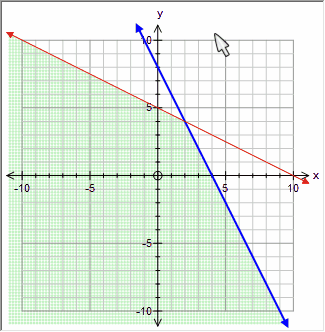
Dotted shading
Uses an array of dots. The graph tool tests an array of coordinates and determines whether each point satisfies all inequations. Any points which satisfy all inequations are displayed. Dotted shading is a more robust approach - the complexity of the regions does not matter - but it is computationally intensive and does not display as well on some devices.
The graph tool will use dotted shading when the system of inequations is too complicated to solve. For example,
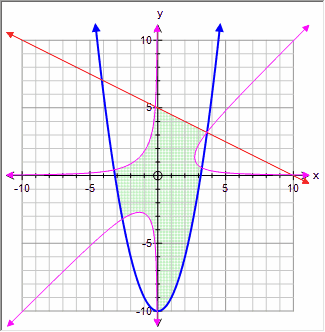
In this case it is the magenta implicitly defined equation that is causing the graph tool to drop down to dotted shading.