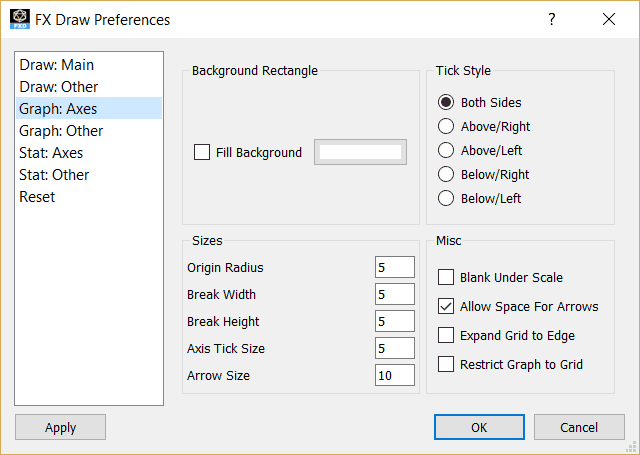
The Graph Axes screen lets you modify the axes style for function graphs. Statistics graphs can have separate settings.
Background Rectangle
Graphs can have a shaded background rectangle. Check the Fill Background option and select your colour.
Sizes
All sizes are in mm and control different aspects of the axes
Tick Style
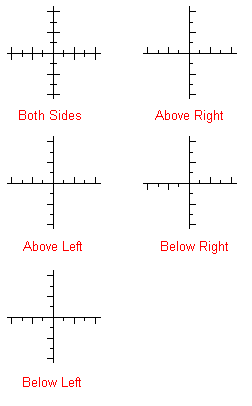
This preference controls how the ticks are drawn on the axes. The various options are best shown in a diagram.
Blank Under Scale
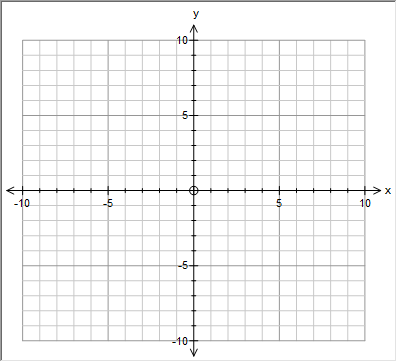
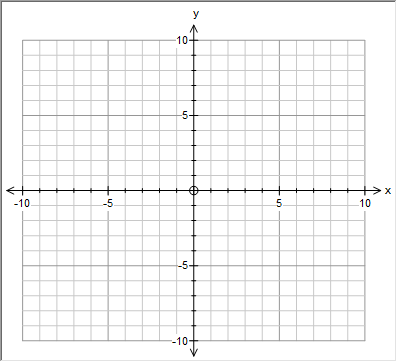
When you add a grid to a set of axes, the lines of the grid can interfere with the scale. The graph tool will blank out an area of the grid before it writes the numbers of the scale and this prevents the grid making the scale hard to read. The blank under scale setting lets you turn off this feature. The two graphs below show you the result. The first graph has Blank Under Scale off, the second graph has it on.
Add Space for Arrows
You can turn arrow heads on and off on graph axes but, either way, space will be allocated for them. If you want the scale to go all the way to the edge, turn off this option.
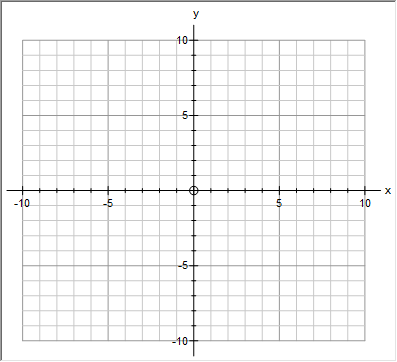
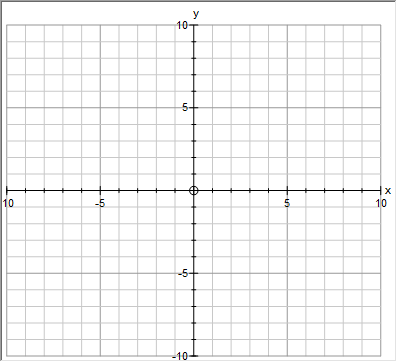
Allow Space for Arrows ON Allow Space for Arrows OFF
Expand Grid to Edge
Allows you to select between two different types of grids.
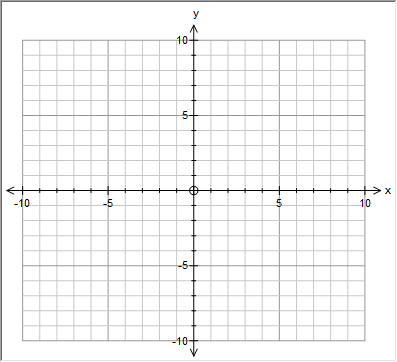
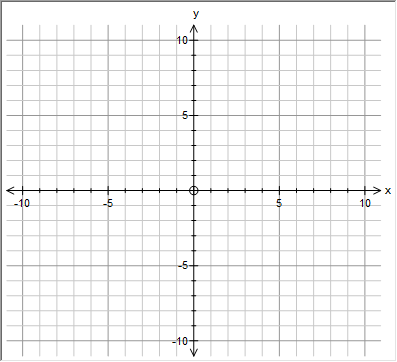
Expand Grid to Edges OFF Expand Grid to Edges ON
Restrict Graph to Grid
You can restrict the graph so that it will not extend outside of the defined grid.
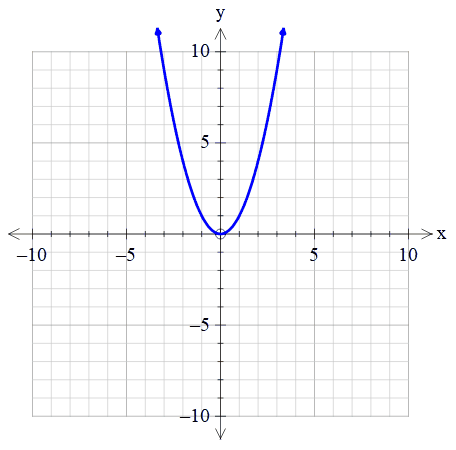
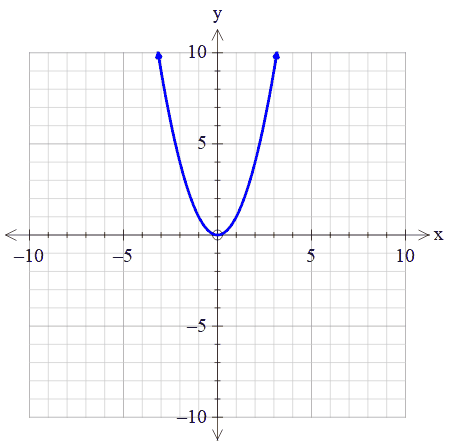
Restrict Graph to Grid Off Restrict Graph to Grid ON